Betting Rules
This betting application is different so the player needs to understand exactly how it works.
Generic Rules:
- INDICATIVE TARGET PRICES: All target prices seen on screen are indicative due to internet latency.
- INDICATIVE ‘CASH OUT’ OFFER: Gulliver100 offers a Cash Out function up until the final seconds to expiry. Gulliver100 shows an indicative bid to the player who wants to Cash Out their bet in order to take their profits or cut their losses. Yet again internet latency shows the Cash Out amount to be at that split second in time; the client could get a higher or lower Cash Out than was expected from the indicative Cash Out amount.
-
PRICE CHART RENDERING: Price charts take time to render or build in a manner that can be presented on your screen. This means
there is a slight delay between the chart price and the up-to-the-second virtual price in the top
right corner of the Betting Ticket.
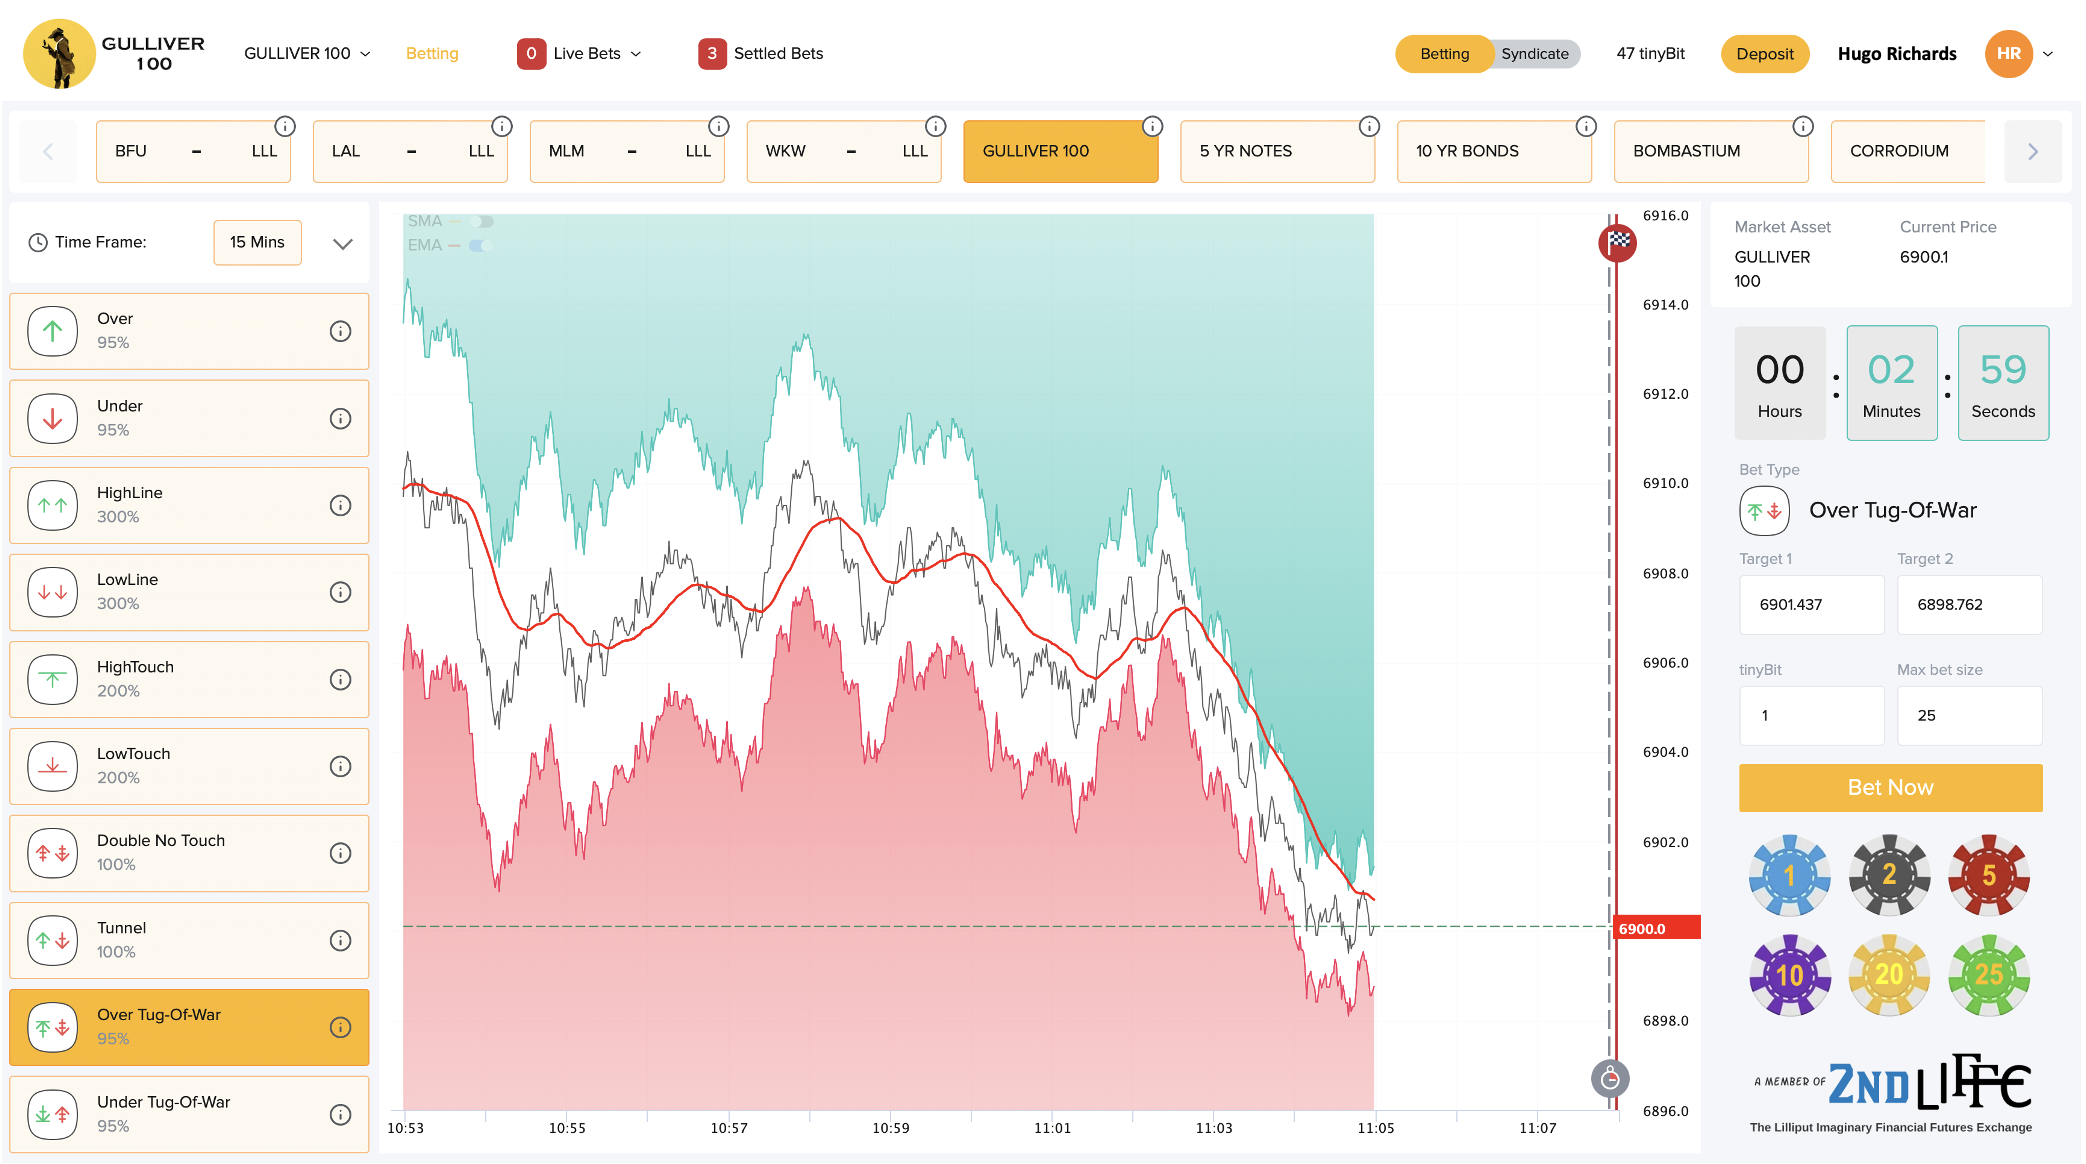
Below on the 'Betting' page, top right, you will see the current Gulliver100 Index price of 6900.1.
This is the fastest up-to-date price. The price 6900.0 (in the red block sliding up and down the price
scale) is slightly delayed.
-
TARGET PRICE/ASSET PRICE SPREAD: Over time you will see the target prices move towards the asset price.
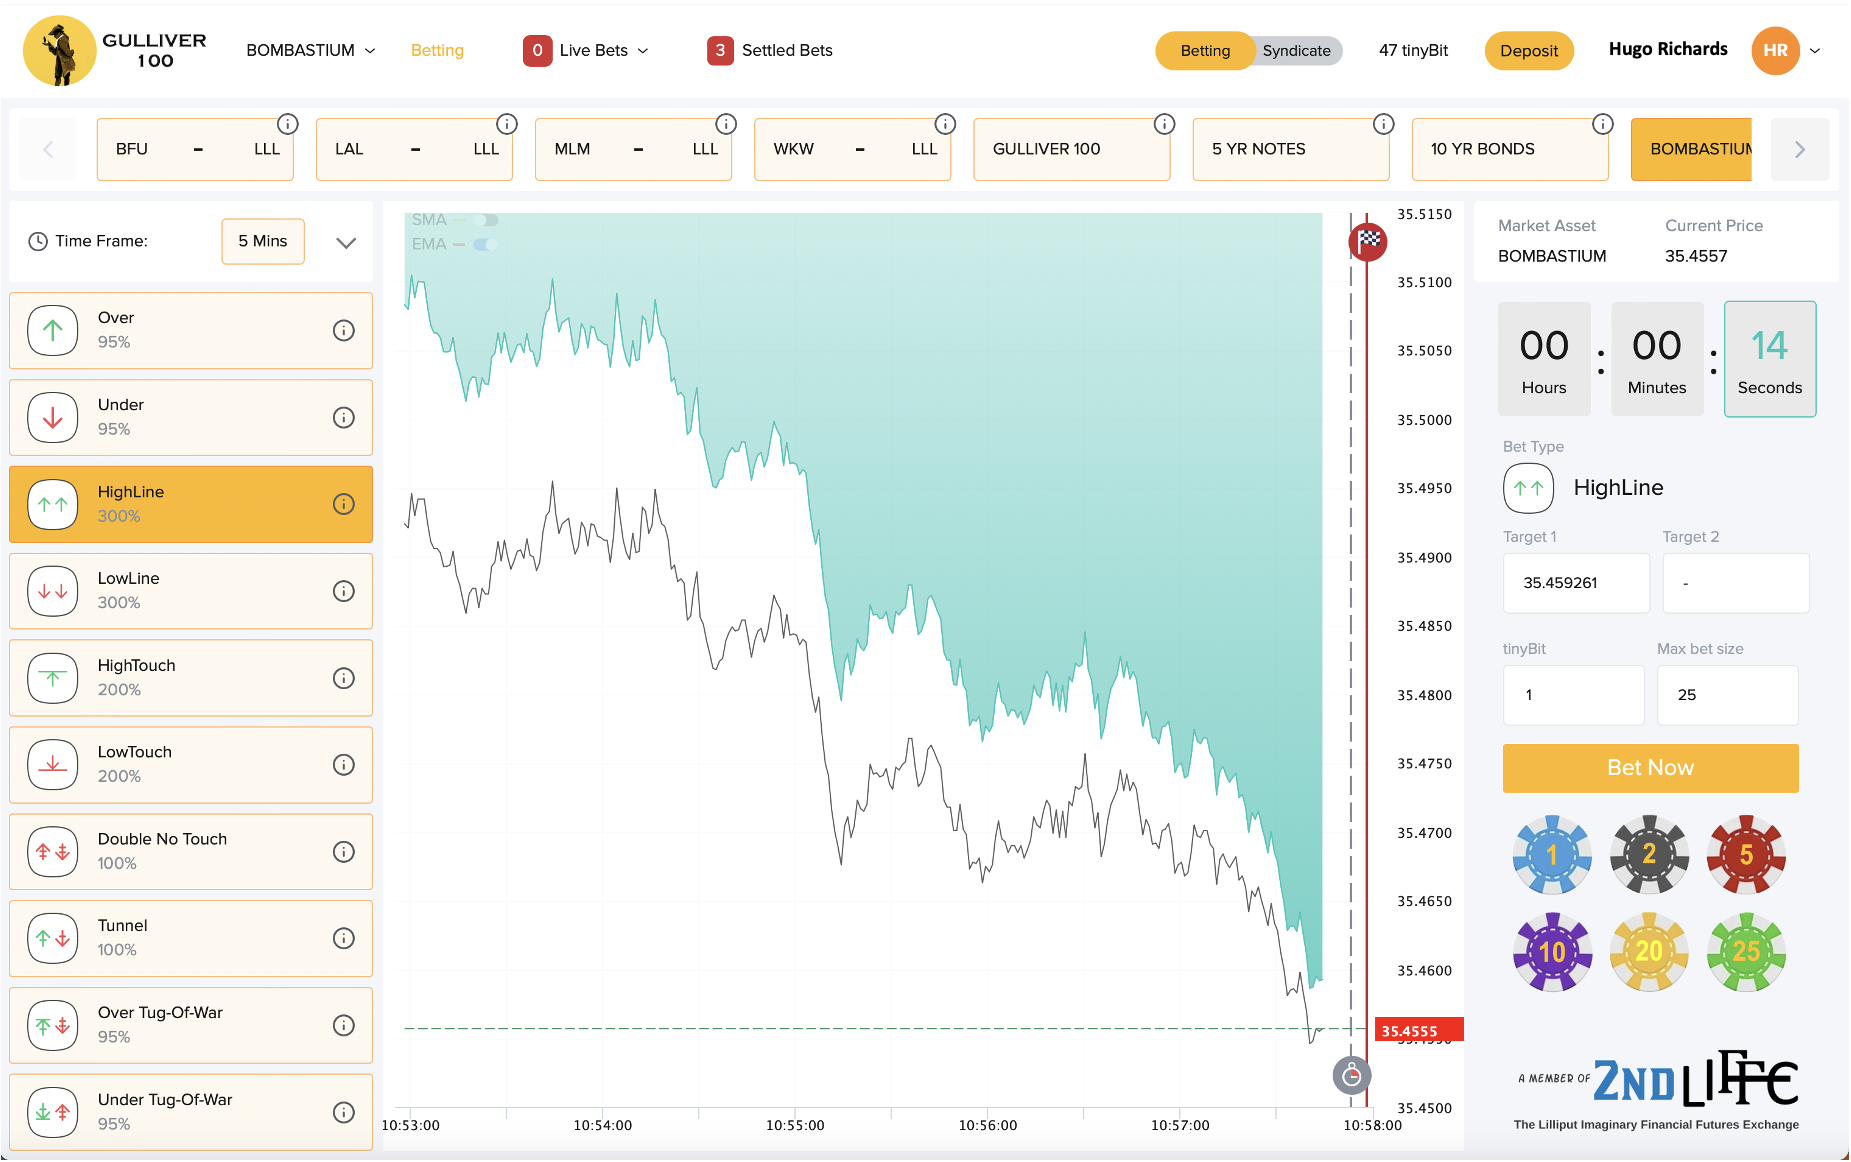
This is because we are a sporting lot who want to treat our clients fairly! For example, take a look at the
HighLine below.
The payout on this bet type is 3/1, 4.0 or 300% depending on the format you choose in Settings. If you look at the distance between the virtual asset price (black) and the target price (blue outlining the green shading) you will see that the gap is greater on the left than just prior to the ‘Bet Suspended’ vertical dashed line on the right. If this gap between the target price and virtual asset price was constant throughout the life of the bet then the earlier you place the bet the greater your chance of winning the 3/1, 4.0, 300% payout. A constant gap between the virtual asset price and the target means the client’s probability of winning literally diminishes by the second. A gradual reduction of the gap means the client has the same probability of winning irrespective of how much time the bet has until it’s ended.
 Clearly the jaws of the Tunnel are much wider on the left than on the right of the price chart meaning that you, the client, have the same probability of winning irrespective of how much time there is before the bet finishes. In this instance, if the target price difference was constant then the later you leave it before entering a bet then the greater the chance of you winning, which is unfair on (sporting) us.
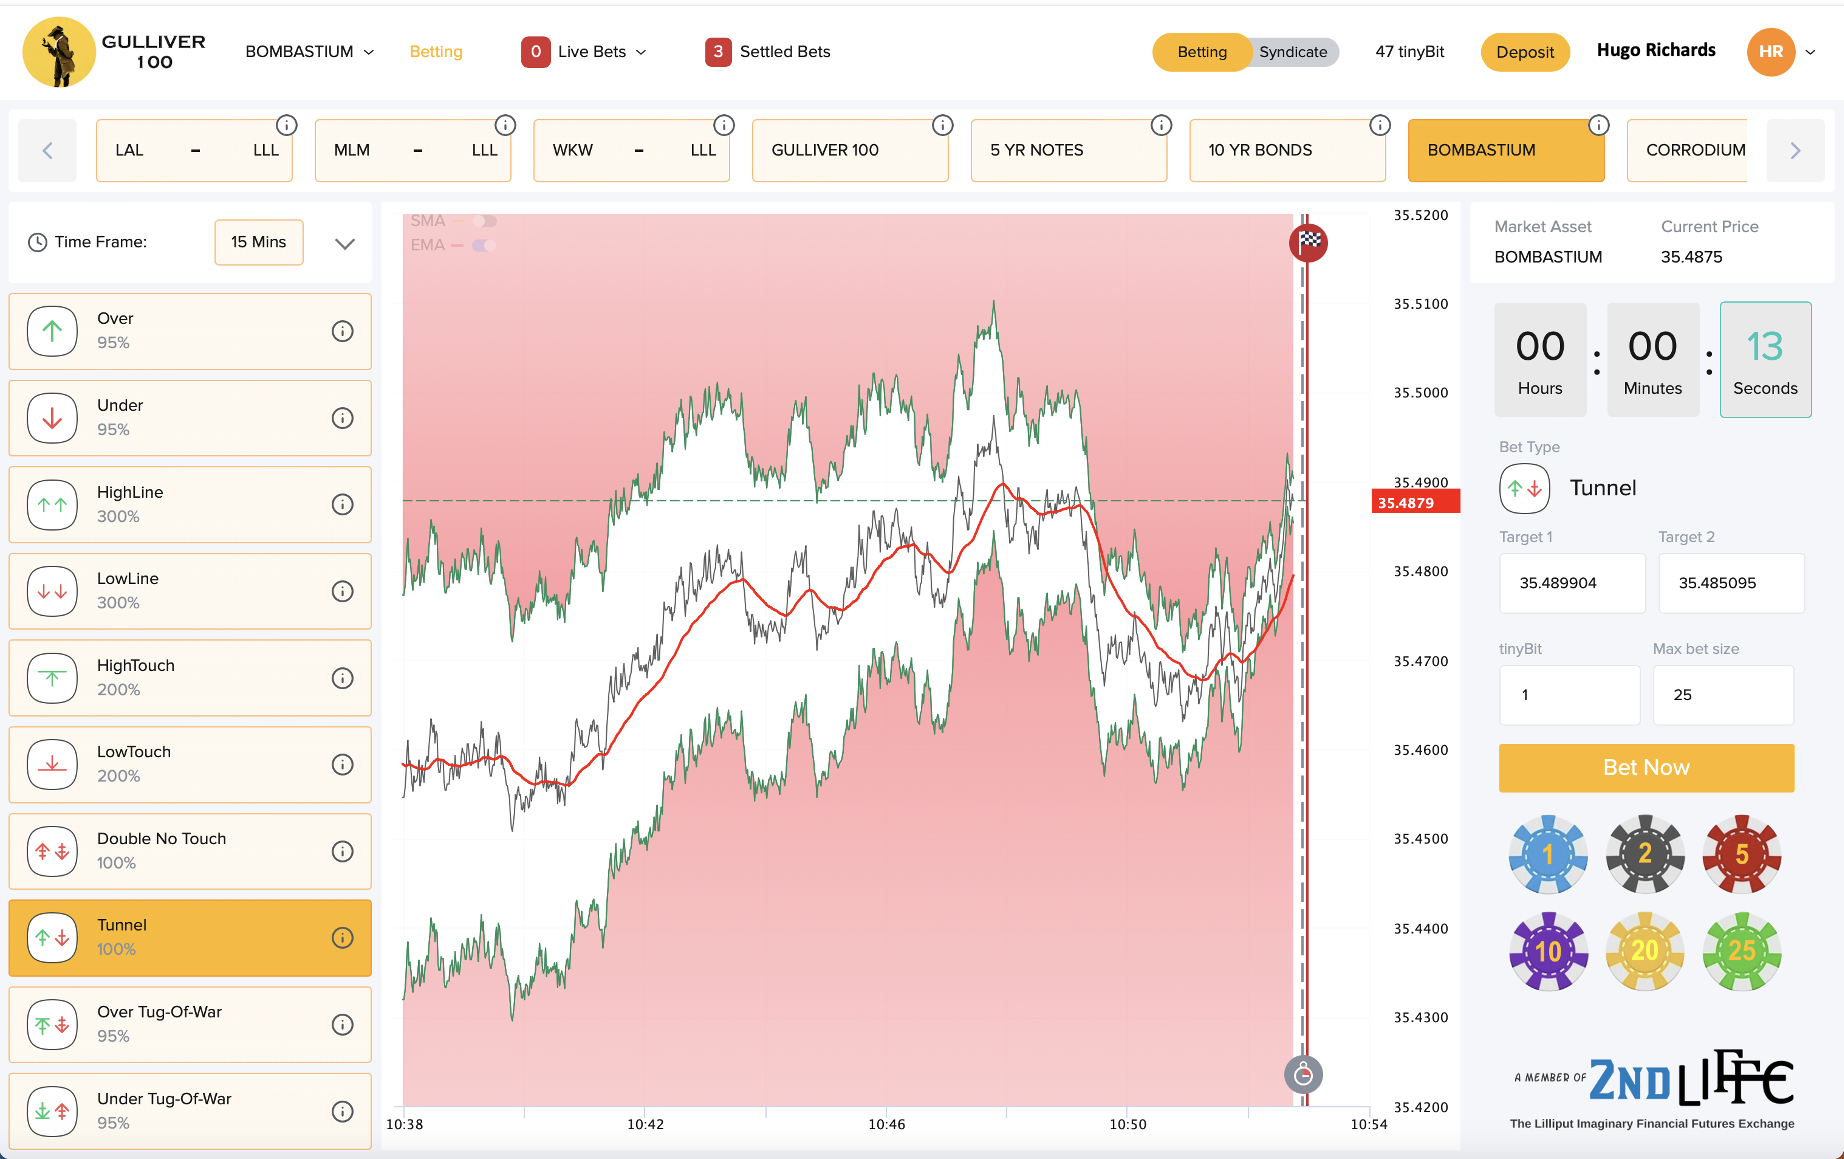
-
COLOUR FORMATTING: In the Tunnel chart the red is the ‘no go’ area and is where the bet will lose. The
HighLine chart above shows a blue shading where the bet will win. This colour format is common to all
bets.
The colour of the lines of the targets is also relevant. In the Tunnel one can see the boundary lines are coloured green. This means it is OK for the virtual asset price to stray into the red areas and that the position of the asset price at the ‘Finish Line’ is what counts.
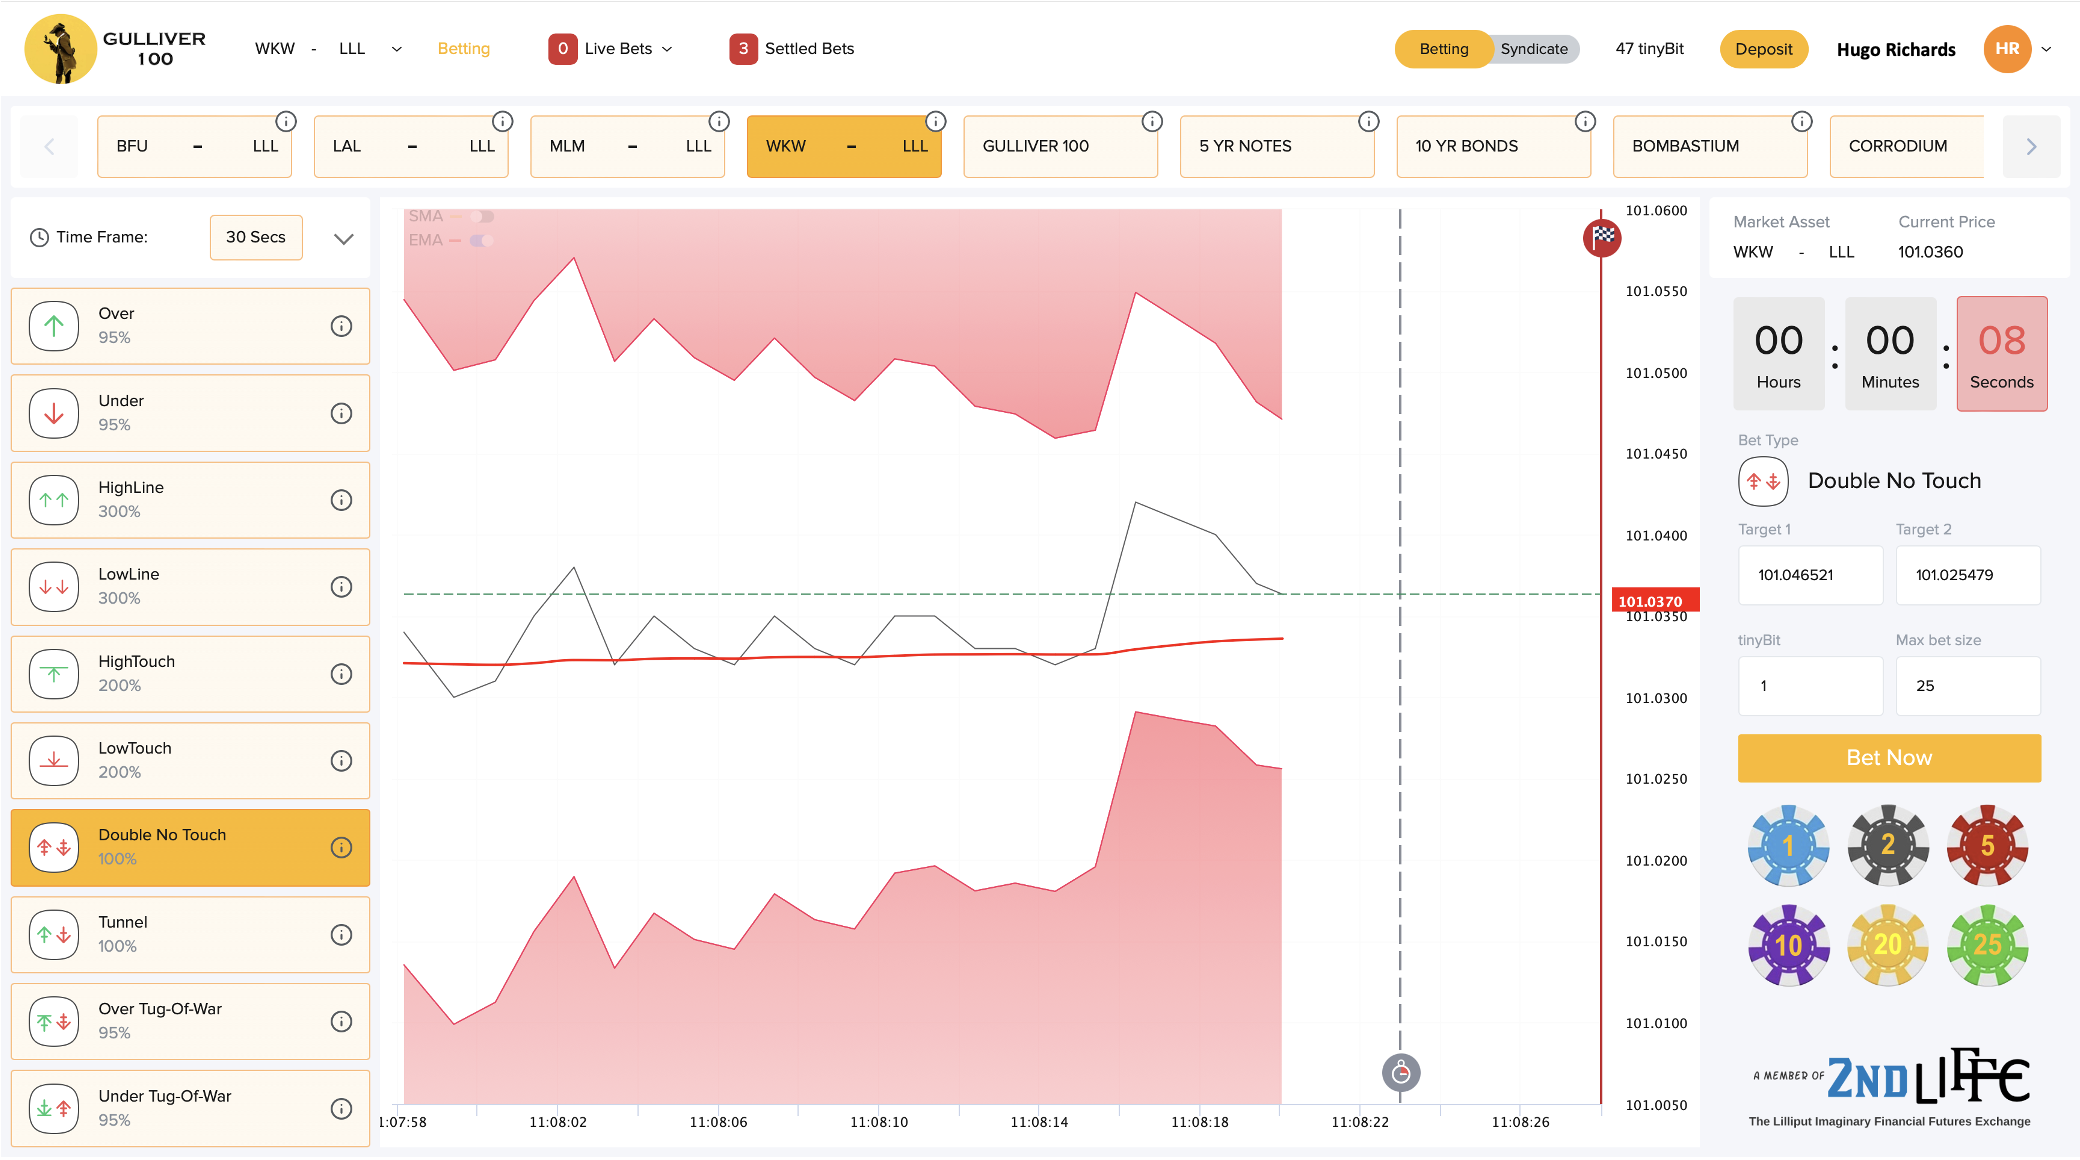
Below, the Double No-Touch has red lines (not green) to depict that the virtual asset price must not even touch one of these lines to avoid the bet being KO’d.